
Delwedd:Cape Town 2001 dominant language map.svg

Maint rhagolwg PNG o ffeil SVG yw: 505 × 599 picsel. Eglurdebau eraill: 202 × 240 picsel | 404 × 480 picsel | 647 × 768 picsel | 863 × 1,024 picsel | 1,726 × 2,048 picsel | 814 × 966 picsel.
Maint llawn (Ffeil SVG, maint mewn enw 814 × 966 picsel, maint y ffeil: 1.48 MB)
Crynodeb
| Disgrifiad |
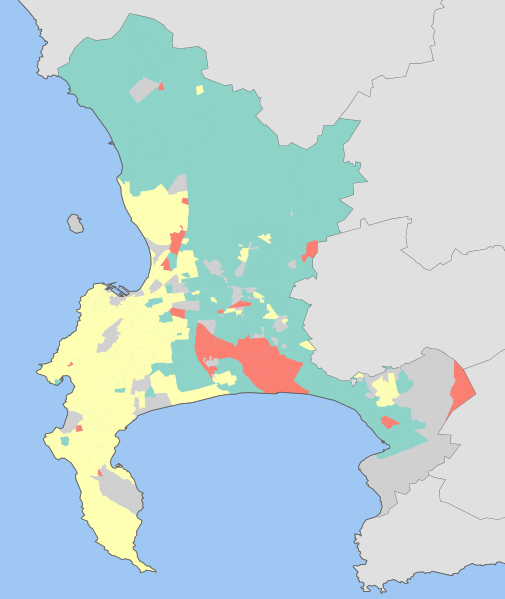
English: Map showing the dominant home languages in the City of Cape Town, Western Cape, South Africa, according to Census 2001 at the "Subplace" level. In this context, a language is dominant if it more than 50% of the population in an area speak it at home, or more than 33% speak it and no other language is spoken by more than 25%.
Afrikaans
English
isiXhosa
No language dominant |
| Dyddiad | |
| Ffynhonnell | Statistics South Africa's Census 2001 is the source of the basic population data. The map results from my own processing of the data. |
| Awdur | Htonl |
Trwyddedu
The following license applies to the population data on which the map is based:

|
Mae deiliad hawlfraint y ffeil hon, sef Stats SA, yn caniatáu i unrhyw un ei defnyddio i unrhyw bwrpas, ar yr amod bod deiliad yr hawlfraint yn cael ei gydnabod yn iawn. Mae ailddosbarthu, gwaith deilliadol, defnydd masnachol, a phob defnydd arall yn cael ei ganiatáu. |
Cydnabyddiaeth:
"the user acknowledges Stats SA as the source of the basic data wherever they process, apply, utilise, publish or distribute the data, and also that they specify that the relevant application and analysis (where applicable) result from their own processing of the data" [1]
|
The following tag applies to the map itself:
| Yr wyf fi, deiliad hawlfraint y gwaith hwn, yn ei ryddhau i'r parth cyhoeddus, a hynny'n fyd-eang. Hwyrach nad yw hyn yn bosib yn ôl cyfraith rhai gwledydd; os felly: Rwyn rhoi i unrhywun yr hawl i ddefnyddio'r gwaith hwn at unrhyw ddiben, heb unrhyw amodau, oddieithr unrhyw amodau gofynnol yn ôl y gyfraith. |
Hanes y ffeil
Cliciwch ar ddyddiad / amser i weld y ffeil fel ag yr oedd bryd hynny.
| Dyddiad / Amser | Bawdlun | Hyd a lled | Defnyddiwr | Sylw | |
|---|---|---|---|---|---|
| cyfredol | 17:42, 16 Chwefror 2010 | | 814 × 966 (1.48 MB) | Htonl | size |
| 21:17, 15 Chwefror 2010 |  | 842 × 1,000 (1.46 MB) | Htonl | tweak | |
| 16:17, 15 Chwefror 2010 |  | 842 × 1,000 (1.37 MB) | Htonl | =={{int:filedesc}}== {{Information |Description={{en|1=Map showing the dominant home languages in the City of Cape Town, Western Cape, South Africa, according to Census 2001 at the "Subplace" level. In this context, a language is dominant if it more than |
Cysylltiadau'r ffeil
Mae'r 1 tudalennau a ddefnyddir isod yn cysylltu i'r ddelwedd hon:
Defnydd cydwici y ffeil
Mae'r wicis eraill hyn yn defnyddio'r ffeil hon:
- Y defnydd ar be-tarask.wikipedia.org
- Y defnydd ar gl.wikipedia.org